OpenEBench TCGA Cancer Driver Genes benchmarking workflow


Description
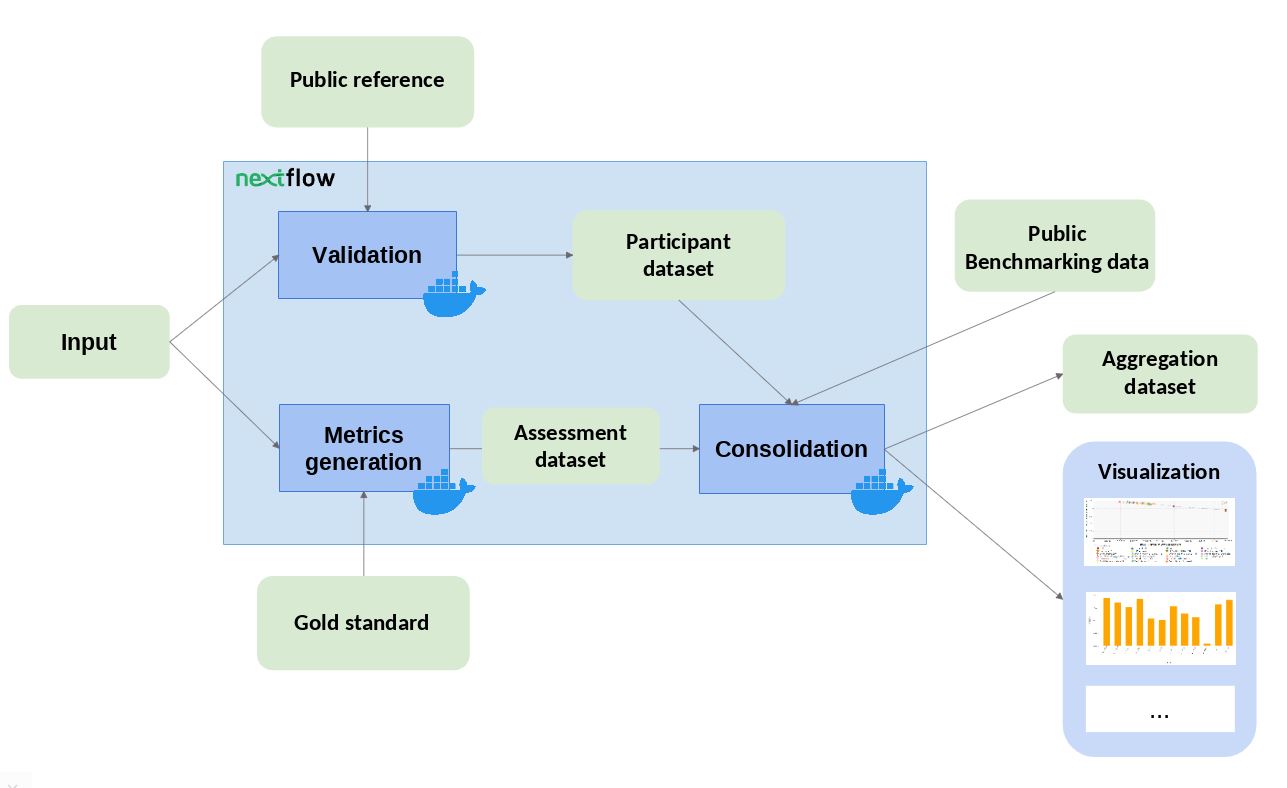
The workflow takes an input file with Cancer Driver Genes predictions (i.e. the results provided by a participant), computes a set of metrics, and compares them against the data currently stored in OpenEBench within the TCGA community. Two assessment metrics are provided for that predictions. Also, some plots (which are optional) that allow to visualize the performance of the tool are generated. The workflow consists in three standard steps, defined by OpenEBench. The tools needed to run these steps are containerised in three Docker images, whose recipes are available in the TCGA_benchmarking_dockers repository and the images are stored in the INB GitLab container registry . Separated instances are spawned from these images for each step:
- Validation : the input file format is checked and, if required, the content of the file is validated (e.g check whether the submitted gene IDs exist)
- Metrics Generation : the predictions are compared with the 'Gold Standards' provided by the community, which results in two performance metrics - precision (Positive Predictive Value) and recall(True Positive Rate).
-
Consolidation
: the benchmark itself is performed by merging the tool metrics with the rest of TCGA data. The results are provided in JSON format and SVG format (scatter plot).
Code Snippets
104 105 106 | """ python /app/validation.py -i $input_file -r $ref_dir -com $community_id -c $cancer_types -p $tool_name -o validation.json """ |
130 131 132 | """ python /app/compute_metrics.py -i $input_file -c $cancer_types -m $gold_standards_dir -p $tool_name -com $community_id -o assessment.json """ |
153 154 155 156 157 | """ cp -Lpr $benchmark_data augmented_benchmark_data python /app/manage_assessment_data.py -b augmented_benchmark_data -p $assessment_out -o aggregation_dir python /app/merge_data_model_files.py -p $validation_out -m $assessment_out -a aggregation_dir -o data_model_export.json """ |
Support
- Share:
-

-

-

 10.1016/j.cell.2018.02.060
- Future updates
Related Workflows


