


subsampler
A pipeline for subsampling genomic data based on epidemiological time series data.
Citing
If you use this tool in a publication, please cite this DOI:
10.5281/zenodo.7065455
Alternatively, you can cite the original manuscript:
Alpert, T., Brito, A. F., Lasek-Nesselquist, E., Rothman, J., Valesano, A. L., MacKay, M. J., ... & Grubaugh, N. D. (2021). Early introductions and transmission of SARS-CoV-2 variant B.1.1.7 in the United States . Cell, 184(10), 2595-2604.
Requirements
subsampler
runs on MacOS and Linux. To run all steps until the actual subsampling, besides having
conda
and the
subsampler
environment installed (see next section), you need to provide the following files:
-
Metadata file containing columns with at least: sample names (
strain, oraccession number),date, and geographic columns (country,division, etc). -
Matrix of daily case counts per geographic location (matching the geographic level of interested, included in the metadata)
Note
-
If you only need to run this pipeline to calculate the proportion of sequenced cases per geographic location, per unit of time, you just need to run the pipeline up to the
correct_biasstep (snakemake correct_bias). It will produce a matrix with the proportions of sequenced cases. -
For this pipeline to run up to its last step (
snakemake subsample), the metadata file itself must contain the minimum set of columns (described above), correctly named in the Snakefile ( here ). -
The complete run of
subsamplergenerates, among other files, a TXT file containing a list of accession numbers (gisaid_epi_isl, for example) or genome names (strain, for example), provided the corresponding columns are found in the metadata file used as input. Such list of genome names or (especially) accession numbers can be used to download an actual sequence file from a genomic database (GISAID, for example), so that further analyses can be performed.
Installation
git clone https://github.com/andersonbrito/subsampler.git
cd config
conda env create -f subsampler.yaml
conda activate subsampler
To update the conda environment, run:
cd config
conda env update -f subsampler.yaml
Alternatively,
mamba
can also be used to install the
subsampler
conda environment.
Pipeline overview
 Figure 1. Workflow Overview
Creating case count matrix
subsampler
can perform subsampling using epidemiological data from any geographical level (per country, per states, etc) provided daily case counts are available
. See more details in the 'Execution' section. To prepare
-
Download and provide a daily case data file
-
Generate matrix of case counts, per location (Y axis), per day (X axis)
Creating genome matrix
The pipeline will perform these actions:
-
Read genomic metadata file
-
Convert date format to YYYY-MM-DD
-
Generate matrix of genome counts, per location (Y axis), per day (X axis)
Aggregating genomic and epidemiological data per epiweek
The pipeline will perform these actions:
-
Combine genomic and case counts per unit of time (week, month, or year)
-
Drop data from time periods outside the boundaries defined by
start_dateandend_date.
Correcting genomic sampling bias
The pipeline will perform these actions:
-
Read matrices with case and genome counts
-
Generate matrix reporting the observed sampling proportions per unit of time
-
Generate matrix reporting the sampling bias (under- and oversampling) given the baseline defined by the user
-
Generate matrix with the corrected genome count per unit of time, given the pre-defined baseline sampling proportion
Perform subsampling
The pipeline will perform these actions:
-
Read metadata and corrected genomic count matrix
-
Read lists of genomes to be kept or remove in all instances (if provided)
-
Read the filter file, to include or exclude genomes from certain metadata categories
-
Perform subsampling guided by case counts per unit of time
-
Generate a list subsampled sequences, and a corresponding metadata file
-
Generate a report with number of sampled genomes per location
Execution
To run this pipeline, users need to provide a TSV file of daily case counts similar to the format below:
Global case counts
| code | country | 2021-01-01 | 2021-01-02 | 2021-01-03 | 2021-01-04 | 2021-01-05 | ... |
|---|---|---|---|---|---|---|---|
| ABW | Aruba | 20 | 23 | 32 | 42 | 110 | ... |
| AFG | Afghanistan | 0 | 0 | 0 | 1485 | 94 | ... |
| AGO | Angola | 15 | 40 | 34 | 42 | 72 | ... |
| AIA | Anguilla | 0 | 0 | 2 | 0 | 0 | ... |
| ALB | Albania | 0 | 675 | 447 | 185 | 660 | ... |
| AND | Andorra | 68 | 49 | 26 | 57 | 59 | ... |
| ARE | United Arab Emirates | 1856 | 1963 | 1590 | 1501 | 1967 | ... |
| ARG | Argentina | 4080 | 5240 | 5884 | 8222 | 13790 | ... |
| ARM | Armenia | 329 | 60 | 229 | 193 | 324 | ... |
| ... | ... | ... | ... | ... | ... | ... | ... |
Country-level case counts
| code | state | 2021-01-01 | 2021-01-02 | 2021-01-03 | 2021-01-04 | 2021-01-05 | ... |
|---|---|---|---|---|---|---|---|
| AK | Alaska | 5 | 802 | 297 | 264 | 200 | ... |
| AL | Alabama | 4521 | 3711 | 2476 | 2161 | 5498 | ... |
| AR | Arkansas | 4304 | 2000 | 2033 | 1306 | 4107 | ... |
| AS | American Samoa | 0 | 0 | 0 | 0 | 0 | ... |
| AZ | Arizona | 10060 | 8883 | 17234 | 5158 | 5932 | ... |
| CA | California | 39425 | 50222 | 37016 | 38256 | 38962 | ... |
| CO | Colorado | 3064 | 2011 | 2078 | 2185 | 3458 | ... |
| CT | Connecticut | 0 | 4412 | 0 | 4516 | 2332 | ... |
| DC | District of Columbia | 269 | 257 | 255 | 140 | 262 | ... |
| ... | ... | ... | ... | ... | ... | ... | ... |
Using one of the commands below, users can download reformatted daily case count files automatically from CSSE at Johns Hopkins University :
Global data
python scripts/get_daily_matrix_global.py --download yes
US data
python scripts/get_daily_matrix_usa.py --download yes
Users can provide their own daily case count file, as long as it matches the format above (tab-separated, with daily counts, and a column with unique identifiers). If one of the commands above is used, the reformatted matrix of case counts would need to be placed inside
/data
, and should be named
here
.
Now, edit the Snakefile to fix the following lines:
-
start_date = "YYYY-MM-DD" (select the start date according to your needs)
-
end_date = "YYYY-MM-DD" (select the end date according to your needs)
-
extra_columns = second column with identifier, such as region, continent (a column found in the original metadata file, which you want to see displayed alongside the
geo_columnin the final outputs)
Obtaining the percentage of sequenced cases per week
The
subsampler
pipeline allows users to calculate the percentage of sequenced cases per location. It aggregates both genome counts and case counts per unit of time, per location (country or state), and proceed with calculations (genomes/cases) to get a time series of proportions of sequenced cases, information useful for monitoring how genomic surveillance is going in different locations.
To that end, the user needs to provide a metadata matrix, similar to the one used by
nextstrain
, which can be downloaded from
GISAID
, under
Downloads > Genomic Epidemiology
. Add the name of that file
here
, place it inside
/data
, and run the pipeline up to the
correct_bias
step using the command below:
snakemake correct_bias
After a few minutes, among the files in
/outputs
, users will find three matrices, one of them showing the weekly proportion of sequenced cases:
matrix_cases_unit.tsv
matrix_genomes_unit.tsv
weekly_sampling_proportions.tsv
Obtaining a list of genomes, sampled based on time series of COVID-19 cases
To obtain a list of genomes sampled based on case counts, the last step of the pipeline need to be executed:
snakemake subsample
Downloading genome sequences
One of the outputs of this pipeline is
selected_sequences.txt
. If
id_column
is set
here
as
gisaid_epi_isl
, a list of accession numbers of subsampled genomes will be generated. Using that list, proceed as follows:
-
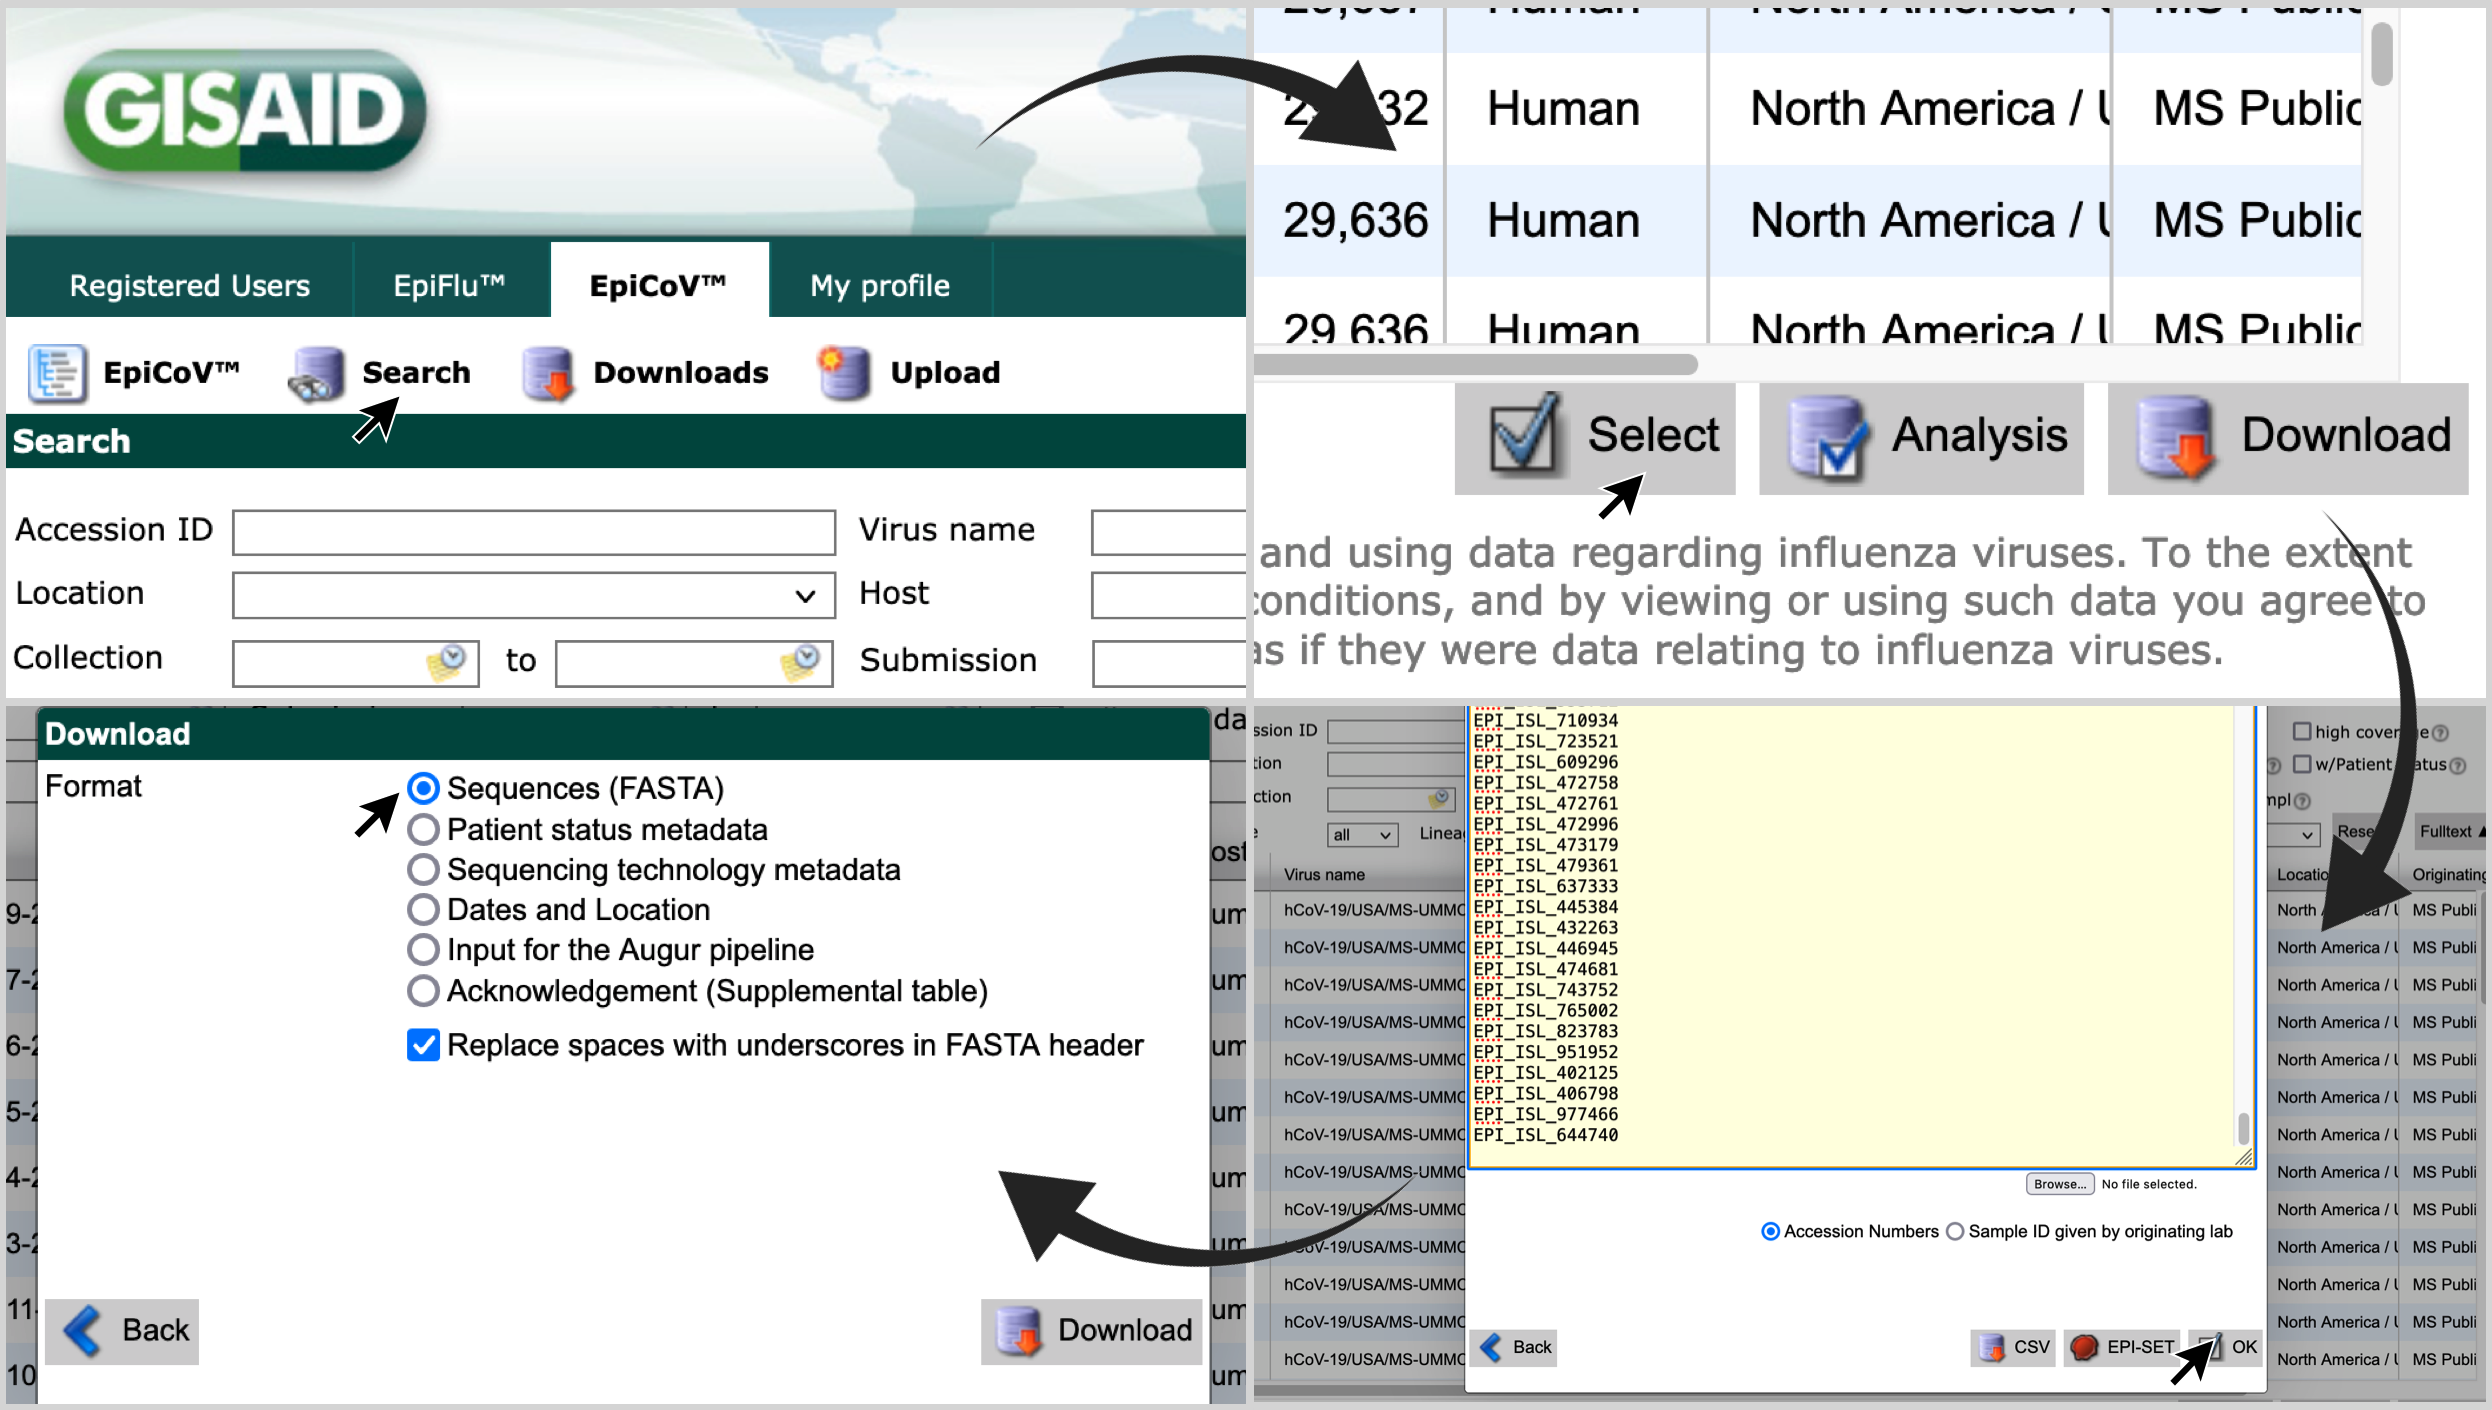
Go to gisaid.org ; and visit the 'Search' page of 'EpiCov'.
-
Click on 'Select'; paste the list of accession numbers in the search box; click on 'OK'; and choose the format 'Sequences (FASTA)'.
Outbreak scale and its impact on subsampling
Given the observed number of reported cases in each unit of time (week, month, etc),
subsampler
attempts to normalized the distribution of genomes sampled over time, following a pre-defined proportion of sequenced cases, a baseline defined by the user (
here
). The scales of the outbreaks worldwide, however, differ by many orders of magnitude, what poses an extra challenge when it comes to subsampling in proportion to reported cases: while a country with 10 million inhabitants may report a few thousand cases per week, larger countries (with populations greater than 100 million) may report more than a million cases in a week. Such large scale may overwhelm the representation of smaller countries in the final dataset, especially if the baseline is not carefully adjusted.
Let's take a look at an example involving the USA (329,5 million inhabitants). Below we have the observed numbers of reported cases and the number of sequenced cases earlier in the pandemic. Under scenarios simulating different proportions of sequenced cases, hundreds or even thousands of genomes may be sampled from each week.
| Country | Data type | 2020_EW10 | 2020_EW11 | 2020_EW12 | 2020_EW13 | 2020_EW14 |
|---|---|---|---|---|---|---|
| United States | Observed number of reported cases | 378 | 2575 | 23047 | 101392 | 192359 |
| United States | Observed number of genomes | 358 | 1695 | 4135 | 3162 | 771 |
| United States | Expected number of genomes under a scenario of 0.1% sequenced cases | 0 | 3 | 24 | 102 | 193 |
| United States | Expected number of genomes under a scenario of 1% sequenced cases | 4 | 26 | 231 | 1014 | 1924 |
| United States | Expected number of genomes under a scenario of 5% sequenced cases | 19 | 129 | 1153 | 5070 | 9618 |
However, under the same parameters shown above, when we look at scenarios in a country with a smaller population, for example, the United Arab Emirates (9.9 million inhabitants), the number of sampled genomes in a given week may be a few dozen, or none at all, as the baseline may be too low to allow sampling of even a single genome. For example, 0.01% sequenced cases in a week with 7,000 reported cases would suggest the sampling of 0.7 genomes, which cannot be performed. In this situation, the expected number of genomes is set to zero. Below we have an example showing the observed numbers of reported cases and the number of sequenced cases in the United Arab Emirates, and the resulting subsampling in different scenarios (see the expected number of genomes in rows where the baseline was set as 0.1 or 1% sequenced cases).
| Country | Data type | 2020_EW10 | 2020_EW11 | 2020_EW12 | 2020_EW13 | 2020_EW14 |
|---|---|---|---|---|---|---|
| United Arab Emirates | Observed number of reported cases | 24 | 40 | 68 | 315 | 1037 |
| United Arab Emirates | Observed number of genomes | 0 | 8 | 5 | 5 | 7 |
| United Arab Emirates | Expected number of genomes, under a scenario of 0.1% sequenced cases | 0 | 0 | 0 | 0 | 2 |
| United Arab Emirates | Expected number of genomes, under a scenario of 1% sequenced cases | 0 | 0 | 0 | 4 | 11 |
| United Arab Emirates | Expected number of genomes, under a scenario of 5% sequenced cases | 2 | 2 | 4 | 16 | 52 |
In summary, given the differences in outbreak scales, depending on the research questions, the user should set up the baseline accordingly, to allow sampling from specific locations or time periods (for example, early phases of an epidemic, where smaller number of cases are reported).
Subsampler may not be what you need if...
If your questions are not directly related to phylogeography, the
subsampler
approach (to obtain subsets of genomes sampled based on case counts) may not be what you need. Since the sampling is weighted by case counts,
subsampler
is more likely to sample genomes from heavily impacted countries (those with more reported cases), and the lower the
baseline
(the percentage of sequenced cases), the less likely would it be for countries facing small scale outbreaks to be represented (for example, the least populated countries), which end up being overshadowed by larger countries, which may report hundred thousands of cases per week.
If you are not trying to infer ancestral states in a phylogeographic perspective, but is more interested in phylodynamic questions, subsampling based on the timing of the events (waves, introductions, seasons, etc) is a better approach.
In this repository you can find
genome_selector.py
, a
python script
designed to sample genomes without taking into account case counts, but instead, following specific variables (date of colection, country, viral lineage, or any other metadata column). For example, the table below illustrates a sampling scheme to obtain around 650 genomes of viruses belonging to lineage
B.1.1.7
(Alpha variant), circulating in the US and the UK, between 2020-12-01 and 2021-06-30, with other US and European samples as contextual genomes. In this hypothetical example, note that US contextual genomes are selected from two time periods, and in different proportions: 50 genomes up to late November 2020, and 100 genomes from December 2020 onwards (from any lineage). Following these criteria, genomes will be sampled per week, and the number of genomes in each week will be proportionally defined by the number of available genomes in each week, according to the parameters defined in each row of the
sampling scheme file
.
Also, the scheme is set up to ignore genomes from California and Scotland: genomes from those locations will not be included in any instance, since they are filtered out prior to the genome selection step. To reproduce the scheme below,
genome_selector.py
will use a
--metadata
file listing all genomes from the locations and lineages represented below.
genome_selector.py
is
not
part of
subsampler
. It should be executed separately:
python genome_selector.py --metadata METADATA --scheme SCHEME
... where
--scheme
is a TSV file with this format:
| purpose | filter | value | filter2 | value2 | sample_size | start | end |
|---|---|---|---|---|---|---|---|
| focus | pango_lineage | B.1.1.7 | country | USA | 200 | 2020-12-01 | 2021-06-30 |
| focus | pango_lineage | B.1.1.7 | country | United Kingdom | 200 | 2020-12-01 | 2021-06-30 |
| context | region | Europe | 100 | 2020-12-01 | 2021-06-30 | ||
| context | country | USA | 50 | 2020-11-30 | |||
| context | country | USA | 100 | 2020-12-01 | |||
| ignore | division | California | |||||
| ignore | division | Scotland |
Among the outputs of
genome_selector.py
, users will find text files containing the list of around 650 genomes, both as names (e.g. USA/CT-CDC-LC0062417/2021) and as accession numbers (e.g. EPI_ISL_2399048). The last file can be used to filter and download genomes directly from
gisaid.org
, as explained
above
.
Latest major updates
v1.1.0 / 2022-06-12:
-
Fasta file with the actual sequences are no longer required as input file. Now, by default, the pipeline will not inspect the level of completeness of the genomes, but will focus on subsampling based on metadata rows only. However, asessement of sequence quality is still supported.
-
A
filter_fileis now an input of this pipeline (see 'config/filters.tsv', and this line . With this file, users can determine specific data categories to be included or excluded. This feature is useful, for example, for subsampling 'variant-specific' data (e.g. include → pango_lineage → B.1.1.7), among other uses. -
Users can now specify the time unit of the time series (week, month or year), which should be set according to the most adequate time period that match the evolutionary time scale of the viruses under study (for SARS-CoV-2, 'week' is an adequate option, but for Dengue virus, 'month' is the best option).
Code Snippets
1 2 3 4 5 6 7 8 9 10 11 12 13 14 15 16 17 18 19 20 21 22 23 24 25 26 27 28 29 30 31 32 33 34 35 36 37 38 39 40 41 42 43 44 45 46 47 48 49 50 51 52 53 54 55 56 57 58 59 60 61 62 63 64 65 66 67 68 69 70 71 72 73 74 75 76 77 78 79 80 81 82 83 84 85 86 87 88 89 90 91 92 93 94 95 96 97 98 99 100 101 102 103 104 105 106 107 108 109 110 111 112 113 114 115 116 117 118 119 120 121 122 123 124 125 126 127 128 129 130 131 132 133 134 135 136 137 138 139 140 141 | import pandas as pd from epiweeks import Week import argparse import time import platform # print('Python version:', platform.python_version()) # print('Pandas version:', pd.__version__) if __name__ == '__main__': parser = argparse.ArgumentParser( description="Aggregate daily counts as epiweeks, months or year", formatter_class=argparse.ArgumentDefaultsHelpFormatter ) parser.add_argument("--input", required=True, help="Matrix of daily counts per location") parser.add_argument("--unit", required=True, nargs=1, type=str, default='week', choices=['week', 'month', 'year', 'full'], help="Time unit for conversion") parser.add_argument("--format",required=False, nargs=1, type=str, default='float', choices=['float', 'integer'], help="What is the format of the data points (float/integer)?") parser.add_argument("--weekasdate",required=False, nargs=1, type=str, default='no', choices=['start', 'end', 'no'], help="If representing weeks as date, which day of the week should be used?") parser.add_argument("--start-date", required=False, type=str, help="Start date in YYYY-MM-DD format") parser.add_argument("--end-date", required=False, type=str, help="End date in YYYY-MM-DD format") parser.add_argument("--output", required=True, help="TSV matrix with aggregated counts") args = parser.parse_args() input = args.input unit = args.unit[0] data_format = args.format[0] weekasdate = args.weekasdate[0] start_date = args.start_date end_date = args.end_date output = args.output # path = '/Users/anderson/GLab Dropbox/Anderson Brito/ITpS/projetos_itps/metasurvBR/analyses/bubbles_20211016/' # input = path + 'cases_SE35-40_cidades.tsv' # unit = 'week' # output = input.split('.')[0] + '_' + unit + '.tsv' # # start_date = '2020-04-01' # start date of period of interest # end_date = '2021-05-31' # end date of period of interest # start_date = None # end_date = None def load_table(file): df = '' if str(file).split('.')[-1] == 'tsv': separator = '\t' df = pd.read_csv(file, encoding='utf-8', sep=separator, dtype='str') elif str(file).split('.')[-1] == 'csv': separator = ',' df = pd.read_csv(file, encoding='utf-8', sep=separator, dtype='str') elif str(file).split('.')[-1] in ['xls', 'xlsx']: df = pd.read_excel(file, index_col=None, header=0, sheet_name=0, dtype='str') df.fillna('', inplace=True) else: print('Wrong file format. Compatible file formats: TSV, CSV, XLS, XLSX') exit() return df # Load metadata df = load_table(input) # rename column names and drop columns out of date range today = time.strftime('%Y-%m-%d', time.gmtime()) if start_date == None: start_date = pd.to_datetime([col for col in df.columns.to_list() if col[0].isdecimal()]).min() if end_date == None: end_date = today nondate_cols = [] def filter_bydate(df): for column in df.columns.to_list(): if column[0].isdecimal(): date = pd.to_datetime(column) if date >= pd.to_datetime(start_date) and date <= pd.to_datetime(end_date): new_column = date.strftime('%Y-%m-%d') df = df.rename(columns={column: new_column}) df[new_column] = df[new_column].astype(float) if data_format == 'integer': df[new_column] = df[new_column].astype(int) else: df = df.drop(columns=[column]) else: if column not in nondate_cols: nondate_cols.append(column) return df # convert date time_cols = [] def get_newunit(value): if value[0].isdecimal(): date = pd.to_datetime(value) if unit == 'week': epiweek = str(Week.fromdate(date, system="cdc")) # get epiweeks year, week = epiweek[:4], epiweek[-2:] if weekasdate in ['start', 'end']: if weekasdate == 'start': epiweek = str(Week(int(year), int(week)).startdate()) else: epiweek = str(Week(int(year), int(week)).enddate()) else: epiweek = year + '_' + 'EW' + week if epiweek not in time_cols: time_cols.append(epiweek) return epiweek elif unit == 'month': year_month = date.strftime("%Y-%m") if year_month not in time_cols: time_cols.append(year_month) return year_month elif unit == 'year': year = date.strftime("%Y") if year not in time_cols: time_cols.append(year) return year elif unit == 'full': return 'total' else: if unit == 'full': return 'total' else: return value # print(df.head()) # filter, transpose, convert dates to epiweeks, and re-transpose def unit_coverter(df): df = filter_bydate(df).transpose() df['time_variable'] = df.index.map(get_newunit) # create new column 'time_variable', mapping 'dates' df = df.groupby(['time_variable'], as_index=True).sum() # group dates from same 'unit', sum up counts return df.transpose() df = unit_coverter(df) df = df[nondate_cols + sorted(time_cols)] # output converted dataframes df.to_csv(output, sep='\t', index=False) print('\nConversion successfully completed.\n') |
1 2 3 4 5 6 7 8 9 10 11 12 13 14 15 16 17 18 19 20 21 22 23 24 25 26 27 28 29 30 31 32 33 34 35 36 37 38 39 40 41 42 43 44 45 46 47 48 49 50 51 52 53 54 55 56 57 58 59 60 61 62 63 64 65 66 67 68 69 70 71 72 73 74 75 76 77 78 79 80 81 82 83 84 85 86 87 88 89 90 91 92 93 94 95 96 97 98 99 100 101 102 103 104 105 106 107 108 109 110 111 112 113 114 115 116 117 118 119 120 121 122 123 124 125 126 127 128 129 130 131 132 133 134 135 136 137 138 139 140 141 142 143 144 145 146 147 148 149 150 151 152 | import pandas as pd import numpy as np import argparse if __name__ == '__main__': parser = argparse.ArgumentParser( description="Filter nextstrain metadata files re-formmating and exporting only selected lines", formatter_class=argparse.ArgumentDefaultsHelpFormatter ) parser.add_argument("--genome-matrix", required=True, help="TSV file showing the original genome counts per epiweek") parser.add_argument("--case-matrix", required=True, help="TSV file showing the case counts per epiweek") parser.add_argument("--index-column", required=True, help="Column with unique geographic information") parser.add_argument("--baseline", required=False, type=float, help="Baseline sampling proportion") parser.add_argument("--output1", required=True, help="TSV file showing genome sampling proportions per epiweek") parser.add_argument("--output2", required=True, help="TSV file showing genome sampling bias per epiweek") parser.add_argument("--output3", required=True, help="TSV file showing corrected genome counts per epiweek") args = parser.parse_args() input1 = args.genome_matrix input2 = args.case_matrix unique_id = args.index_column output1 = args.output1 output2 = args.output2 output3 = args.output3 baseline = args.baseline # path = '/Users/anderson/GLab Dropbox/Anderson Brito/projects/ncov_nfl/nextstrain/batch01_20201012e/sampling_prop_Global/outputs/' # input1 = path + 'matrix_genomes_epiweeks.tsv' # input2 = path + 'matrix_cases_epiweeks.tsv' # output1 = path + 'weekly_sampling_proportions.tsv' # output2 = path + 'weekly_sampling_bias.tsv' # output3 = path + 'matrix_genomes_epiweeks_corrected.tsv' # unique_id = 'iso' # baseline = 0.01 # input genome and case counts per epiweek separator = '\t' dfG = pd.read_csv(input1, encoding='utf-8', sep='\t', dtype=str) dfC = pd.read_csv(input2, encoding='utf-8', sep='\t', dtype=str) # get total genomes and cases date_intersection = [] for column in dfG.columns.to_list(): if column[-1].isdecimal(): if column in dfC.columns.to_list(): date_intersection.append(column) # print(date_intersection) def get_sum(df): df = df[date_intersection] df = df.astype(int) return df.values.sum() # calculate average sampling proportion global_samp_prop = get_sum(dfG)/get_sum(dfC) # genomes divided by cases # consider user defined baseline sampling proportion if baseline != None: global_samp_prop = baseline print('\n### Target sampling proportion:\n\n - ' + str(global_samp_prop) + '\n') # set new index dfG.set_index(unique_id, inplace=True) dfC.set_index(unique_id, inplace=True) nonDateCols = [column for column in dfG.columns.to_list() if not column[-1].isdecimal()] # datecols = [column for column in dfG.columns.to_list() if column[-1].isdecimal()] # create empty dataframes dfP = dfG.filter(nonDateCols, axis=1) # sampling proportion dataframe dfB = dfG.filter(nonDateCols, axis=1) # sampling bais dataframe dfW = dfG.filter(nonDateCols, axis=1) # corrected genome count dataframe # print(dfP) # print(dfB) # get sampling proportions and biases no_casedata = [] for idx, row in dfG.iterrows(): # for epiweek in time_cols: total_genomes = 0 total_cases = 0 for epiweek in date_intersection: # print(idx) genome_count = int(dfG.loc[idx, epiweek]) try: case_count = int(dfC.loc[idx, epiweek]) except: case_count = 0 if idx not in no_casedata: no_casedata.append(idx) samp_prop = '' bias = '' corrected_count = '' if int(case_count) > 0 and int(genome_count) > 0: if int(genome_count) > int(case_count): case_count = genome_count samp_prop = int(genome_count)/int(case_count) bias = float(samp_prop - global_samp_prop) corrected_count = 0 if case_count * global_samp_prop >= 0.9: # defines how to proceed when requested values is below 1 genome corrected_count = int(np.ceil(case_count * global_samp_prop)) # print(genome_count, case_count, samp_prop) # print(idx, bias) elif int(case_count) > 0 and int(genome_count) == 0: samp_prop = 0 bias = '-' corrected_count = 0 if case_count * global_samp_prop >= 0.9: # defines how to proceed when requested values is below 1 genome corrected_count = int(np.ceil(case_count * global_samp_prop)) else: samp_prop = 'X' bias = 'X' corrected_count = 0 # print(genome_count, case_count, samp_prop) dfP.loc[idx, epiweek] = samp_prop # add observed sampling proportion dfB.loc[idx, epiweek] = bias # add calculated sampling bias dfW.loc[idx, epiweek] = corrected_count # add corrected genome count # print(corrected_count) dfW[epiweek] = pd.to_numeric(dfW[epiweek], downcast='integer', errors='ignore') # get total counts total_genomes += genome_count total_cases += case_count if total_cases > 0: dfP.loc[idx, 'cumulative_proportion'] = total_genomes / total_cases # print(total_genomes / total_cases) else: dfP.loc[idx, 'cumulative_proportion'] = 'NA' # output processed dataframes dfP.to_csv(output1, sep='\t', index=True) dfB.to_csv(output2, sep='\t', index=True) dfW.to_csv(output3, sep='\t', index=True) # report if len(no_casedata) > 0: print('\n### No case data found for:\n') [print(' - ' + loc) for loc in no_casedata] |
1 2 3 4 5 6 7 8 9 10 11 12 13 14 15 16 17 18 19 20 21 22 23 24 25 26 27 28 29 30 31 32 33 34 35 36 37 38 39 40 41 42 43 44 45 46 47 48 49 50 51 52 53 54 55 56 57 58 59 60 61 62 63 64 65 66 67 68 69 70 71 72 73 74 75 76 77 78 79 80 81 82 83 84 85 86 87 88 89 90 91 92 93 94 95 96 97 98 99 100 101 102 103 104 105 106 107 108 109 110 111 112 113 114 115 116 117 118 119 120 121 122 123 124 125 126 127 128 129 130 131 132 133 134 135 136 137 138 139 140 141 142 143 144 145 146 147 148 149 150 151 152 153 154 155 156 157 158 159 160 161 162 163 164 165 166 167 168 169 170 171 172 173 174 175 176 177 178 179 180 181 182 183 184 185 186 187 188 189 190 191 192 193 194 195 196 197 198 199 200 201 202 203 204 205 206 207 208 209 210 211 212 213 214 215 216 217 218 219 220 221 | import pandas as pd import time import argparse import pycountry_convert as pyCountry import pycountry if __name__ == '__main__': parser = argparse.ArgumentParser( description="Filter nextstrain metadata files re-formmating and exporting only selected lines", formatter_class=argparse.ArgumentDefaultsHelpFormatter ) parser.add_argument("--metadata", required=True, help="Metadata TSV file") parser.add_argument("--index-column", required=True, help="Column with unique geographic information") parser.add_argument("--extra-columns", required=False, nargs='+', type=str, help="extra columns with geographic info to export") parser.add_argument("--date-column", required=True, type=str, help="Column containing the date information") parser.add_argument("--start-date", required=False, type=str, help="Start date in YYYY-MM-DD format") parser.add_argument("--end-date", required=False, type=str, help="End date in YYYY-MM-DD format") parser.add_argument("--output", required=True, help="Genome matrix") args = parser.parse_args() metadata = args.metadata geo_col = args.index_column extra_cols = args.extra_columns date_col = args.date_column group_by = ['code', date_col] start_date = args.start_date end_date = args.end_date output = args.output # path = '/Users/anderson/GLab Dropbox/Anderson Brito/projects/ncov/ncov_variants/nextstrain/run15_20210422_samprop/' # metadata = path + 'data/metadata_nextstrain.tsv' # output = path + 'matrix_genomes_daily.tsv' # geo_col = 'division_exposure' # date_col = 'date' # extra_cols = ['country_exposure'] # group_by = ['code', date_col] # start_date = '2019-12-01' # end_date = '2020-07-22' # start_date = None # end_date = None pd.set_option('display.max_columns', 500) # input genome and case counts per epiweek df = pd.read_csv(metadata, encoding='utf-8', sep='\t', dtype=str) df.fillna('', inplace=True) # fix exposure geolevels = ['region', 'country', 'division'] print('\n * Loading genome metadata\n') for level in geolevels: exposure_column = level + '_exposure' if exposure_column == geo_col: for idx, row in df.iterrows(): if df.loc[idx, exposure_column].lower() in ['', 'unknown']: df.loc[idx, exposure_column] = df.loc[idx, level] # get ISO alpha3 country codes codes = {'Rest of the US': 'RES', 'NewYork/NewJersey': 'NYJ'} def get_iso(country): global codes if country not in codes.keys(): try: isoCode = pyCountry.country_name_to_country_alpha3(country, cn_name_format="default") codes[country] = isoCode except: try: isoCode = pycountry.countries.search_fuzzy(country)[0].alpha_3 codes[country] = isoCode except: codes[country] = '' return codes[country] us_state_abbrev = { 'Alabama': 'AL', 'Alaska': 'AK', 'American Samoa': 'AS', 'Arizona': 'AZ', 'Arkansas': 'AR', 'California': 'CA', 'Colorado': 'CO', 'Connecticut': 'CT', 'Delaware': 'DE', 'District of Columbia': 'DC', 'Washington DC': 'DC', 'Florida': 'FL', 'Georgia': 'GA', 'Guam': 'GU', 'Hawaii': 'HI', 'Idaho': 'ID', 'Illinois': 'IL', 'Indiana': 'IN', 'Iowa': 'IA', 'Kansas': 'KS', 'Kentucky': 'KY', 'Louisiana': 'LA', 'Maine': 'ME', 'Maryland': 'MD', 'Massachusetts': 'MA', 'Michigan': 'MI', 'Minnesota': 'MN', 'Mississippi': 'MS', 'Missouri': 'MO', 'Montana': 'MT', 'Nebraska': 'NE', 'Nevada': 'NV', 'New Hampshire': 'NH', 'New Jersey': 'NJ', 'New Mexico': 'NM', 'New York': 'NY', 'North Carolina': 'NC', 'North Dakota': 'ND', 'Northern Mariana Islands': 'MP', 'Ohio': 'OH', 'Oklahoma': 'OK', 'Oregon': 'OR', 'Pennsylvania': 'PA', 'Puerto Rico': 'PR', 'Rhode Island': 'RI', 'South Carolina': 'SC', 'South Dakota': 'SD', 'Tennessee': 'TN', 'Texas': 'TX', 'Utah': 'UT', 'Vermont': 'VT', 'Virgin Islands': 'VI', 'Virginia': 'VA', 'Washington': 'WA', 'West Virginia': 'WV', 'Wisconsin': 'WI', 'Wyoming': 'WY' } # add state code print('\n * Converting ' + geo_col + ' into codes (acronyms)\n') if 'code' not in df.columns.to_list(): df.insert(1, 'code', '') if 'division' in geo_col: df['code'] = df[geo_col].apply(lambda x: us_state_abbrev[x] if x in us_state_abbrev else '') elif 'country' in geo_col: df['code'] = df[geo_col].apply(lambda x: get_iso(x)) else: df['code'] = df[geo_col] # remove genomes with incomplete dates print('\n * Removing genomes with incomplete dates\n') df = df[df[date_col].apply(lambda x: len(x.split('-')) == 3)] # accept only full dates df = df[df[date_col].apply(lambda x: 'X' not in x)] # exclude -XX-XX missing dates # filter by date print('\n * Filtering genomes by start and end dates\n') today = time.strftime('%Y-%m-%d', time.gmtime()) df[date_col] = pd.to_datetime(df[date_col]) # converting to datetime format if start_date == None: start_date = df[date_col].min() if end_date == None: end_date = today mask = (df[date_col] >= start_date) & ( df[date_col] <= end_date) # mask any lines with dates outside the start/end dates df = df.loc[mask] # apply mask # filter out genomes with missing 'geo_level' name df = df[df['code'].apply(lambda x: len(str(x)) > 0)] # report print('\n* Available genomes\n') print('\tOldest collected sampled = ' + df[date_col].min().strftime('%Y-%m-%d')) print('\tNewest collected sampled = ' + df[date_col].max().strftime('%Y-%m-%d')) print('') # convert back to string format df[date_col] = df[date_col].apply(lambda x: x.strftime('%Y-%m-%d')) # group lines based on date and geolocation, and return genome counts df2 = df.groupby(group_by).size().to_frame(name='genome_count').reset_index() # print(df2) columns = sorted(df[date_col].unique().tolist()) rows = sorted(df['code'].unique().tolist()) # empty matrix dataframe df3 = pd.DataFrame(index=rows, columns=columns) df3 = df3.fillna(0) # with 0s rather than NaNs # give index a name df3.index.name = 'code' # print(df3) # add other columns, if available if extra_cols == None: extra_cols = [] for column in extra_cols: if column in df.columns.to_list(): df3.insert(0, column, '') df.set_index('code', inplace=True) # fill extra columns with their original content for idx, row in df3.iterrows(): for column in extra_cols: if column in df.columns.to_list(): # value = df.loc[idx, column][0] value = df.loc[df.index == idx][column].values[0] df3.at[idx, column] = value # fill matrix with genome counts print('\n * Exporting matrix of daily genome counts\n') found = [] for idx, row in df2.iterrows(): geo = df2.loc[idx, 'code'] time = df2.loc[idx, date_col] count = df2.loc[idx, 'genome_count'] df3.at[geo, time] = count # output processed dataframe df3.to_csv(output, sep='\t', index=True) |
1 2 3 4 5 6 7 8 9 10 11 12 13 14 15 16 17 18 19 20 21 22 23 24 25 26 27 28 29 30 31 32 33 34 35 36 37 38 39 40 41 42 43 44 45 46 47 48 49 50 51 52 53 54 55 56 57 58 59 60 61 62 63 64 65 66 67 68 69 70 71 72 73 74 75 76 77 78 79 80 81 82 83 84 85 86 87 88 89 90 91 92 93 94 95 96 97 98 99 100 101 102 103 104 105 106 107 108 109 110 111 112 113 114 115 116 117 118 119 120 121 122 123 124 125 126 127 128 129 130 131 132 133 134 135 136 137 138 139 140 141 142 143 144 145 146 147 148 149 150 151 152 153 154 155 156 157 158 159 160 161 162 163 164 165 166 167 168 169 170 171 172 173 174 175 176 177 178 179 180 181 182 183 184 185 186 187 188 189 190 191 192 193 194 195 196 197 198 199 200 201 202 203 204 205 206 207 208 209 210 211 212 213 214 215 216 217 218 219 220 221 222 223 224 225 226 227 228 229 230 231 232 233 234 235 236 237 238 239 240 241 242 243 244 245 246 247 248 249 250 251 252 253 254 255 256 257 258 259 260 261 262 263 264 265 266 267 268 269 270 271 272 273 274 275 276 277 278 279 280 281 282 283 284 285 286 287 288 289 290 291 292 293 294 295 296 297 298 299 300 301 302 303 304 305 306 307 308 309 310 311 312 313 314 315 316 317 318 319 320 321 322 323 324 325 326 327 328 329 330 331 332 333 334 335 336 337 338 339 340 341 342 343 344 345 346 347 348 349 350 351 352 353 354 355 356 357 358 359 360 361 362 363 364 365 366 367 368 369 370 371 372 373 374 375 376 377 378 379 380 381 382 383 384 385 386 387 388 389 390 391 392 393 394 395 396 397 398 399 400 401 402 403 404 405 406 407 408 409 410 411 412 413 414 415 416 417 418 419 420 421 422 423 424 425 426 427 428 429 430 431 432 433 434 435 436 437 438 439 440 441 442 443 444 445 446 447 448 449 450 451 452 453 454 455 456 457 458 459 460 461 462 463 464 465 466 467 468 469 470 471 472 473 474 475 476 477 478 479 480 481 482 483 484 485 486 487 488 489 490 491 492 493 494 495 496 497 498 499 500 501 502 503 504 505 506 507 508 509 510 511 512 513 514 515 516 517 518 519 520 521 522 523 524 | import pandas as pd from Bio import SeqIO from epiweeks import Week import random import time import argparse import pycountry_convert as pyCountry import pycountry import os from os import listdir if __name__ == '__main__': parser = argparse.ArgumentParser( description="Filter nextstrain metadata files re-formmating and exporting only selected lines", formatter_class=argparse.ArgumentDefaultsHelpFormatter ) parser.add_argument("--sequences", required=False, help="FASTA file with genomes named as in metadata") parser.add_argument("--metadata", required=True, help="Metadata TSV file") parser.add_argument("--genome-matrix", required=True, help="TSV file showing corrected genome counts per unit of time") parser.add_argument("--max-missing", required=False, type=int, default=99, help="Maximum percentage of Ns or gaps (int = 1-100)") parser.add_argument("--refgenome-size", required=False, type=int, default=1, help="Reference genome size") parser.add_argument("--keep", required=False, help="List of samples to keep, in all instances") parser.add_argument("--remove", required=False, help="List of samples to remove, in all instances") parser.add_argument("--filter-file", required=False, help="TSV file listing columns/values of samples to be batch included or excluded") parser.add_argument("--seed", required=False, type=int, help="Seed number for pseudorandom sampling of genomes") parser.add_argument("--index-column", required=True, help="Metadata column with unique genome identifiers (genome names, accession codes, etc") parser.add_argument("--geo-column", required=True, help="Metadata column with the target geographic information (country, division, etc)") parser.add_argument("--date-column", required=True, type=str, help="Metadata column containing the collection dates") parser.add_argument("--time-unit", required=True, nargs=1, type=str, default='week', choices=['week', 'month', 'year', 'full'], help="Time unit for conversion") parser.add_argument("--weekasdate",required=False, nargs=1, type=str, default='no', choices=['start', 'end', 'no'], help="When representing weeks as date, which day of the week should be used?") parser.add_argument("--start-date", required=False, type=str, help="Start date in YYYY-MM-DD format") parser.add_argument("--end-date", required=False, type=str, help="End date in YYYY-MM-DD format") parser.add_argument("--sampled-sequences", required=True, help="Sampled genomes") parser.add_argument("--sampled-metadata", required=True, help="Sampled metadata") parser.add_argument("--report", required=True, help="List of statistics related to the sampling scheme") args = parser.parse_args() metadata_file = args.metadata sampling_file = args.genome_matrix fasta_file = args.sequences genome_size = args.refgenome_size max_gaps = args.max_missing keep = args.keep remove = args.remove filter_file = args.filter_file seed = args.seed id_col = args.index_column geo_level = args.geo_column date_col = args.date_column unit = args.time_unit[0] weekasdate = args.weekasdate[0] start_date = args.start_date end_date = args.end_date outfile_sequences = args.sampled_sequences outfile_metadata = args.sampled_metadata outfile_report = args.report # path = '/Users/anderson/Desktop/subsampler_issues/20220611_update/' # os.chdir(path) # metadata_file = 'data/metadata.tsv' # sampling_file = 'outputs/matrix_genomes_unit_corrected.tsv' # fasta_file = '' #path + 'data/sequences.fasta' # filter_file = 'config/filters.tsv' # # include_file = path + 'config/strict_inclusion.tsv' # # drop_file = path + 'config/batch_removal.tsv' # keep = 'config/keep.txt' # remove = 'config/remove.txt' # id_col = 'gisaid_epi_isl' # geo_level = 'country_exposure' # seed = 2007 # # seed = None # date_col = 'date' # # filter_col = 'date' # genome_size = 29930 # max_gaps = 30 # unit = 'month' # weekasdate = 'no' # start_date = '2020-03-01' # end_date = '2021-01-31' # # start_date = None # # end_date = None # outfile_sequences = 'sequences_corrected.txt' # outfile_metadata = 'metadata_corrected.tsv' # outfile_report = 'report.txt' if seed == None: seed = random.random() # if filter_col == None: # filter_col = date_col # pd.set_option('display.max_columns', 500) def load_table(file): df = '' if str(file).split('.')[-1] == 'tsv': separator = '\t' df = pd.read_csv(file, encoding='utf-8', sep=separator, dtype='str') elif str(file).split('.')[-1] == 'csv': separator = ',' df = pd.read_csv(file, encoding='utf-8', sep=separator, dtype='str') elif str(file).split('.')[-1] in ['xls', 'xlsx']: df = pd.read_excel(file, index_col=None, header=0, sheet_name=0, dtype='str') df.fillna('', inplace=True) else: print('Wrong file format. Compatible file formats: TSV, CSV, XLS, XLSX') exit() return df print('\n### Loading matrices...') # open metadata file dfM = load_table(metadata_file) dfM.fillna('', inplace=True) # print(dfM) # get sequence headers fasta_headers = [] if fasta_file not in ['', None]: print('\n### Loading sequences...') for fasta in SeqIO.parse(open(fasta_file), 'fasta'): id, seq = fasta.description, str(fasta.seq) id = id.split('|')[0].replace(' ', '') size = len(seq.replace('N', '').replace('-', '')) min_size = genome_size - int(genome_size * max_gaps / 100) if size > min_size: fasta_headers.append(id) else: print('size: ' + str(size) + ' bp ' + ' - ' + id + ' contains more than ' + str( max_gaps) + '% of Ns. Skipping...') else: fasta_headers = list(set(dfM[id_col].tolist())) # filter rows def filter_df(df, criteria): print('\n### Filtering rows...') new_df = pd.DataFrame() include = {} for filter_value in criteria.split(','): filter_value = filter_value.strip() if not filter_value.startswith('~'): col, val = filter_value.split(':')[0], filter_value.split(':')[1] if val == '\'\'': val = '' if col not in include: include[col] = [val] else: include[col].append(val) # print('Include:', include) for filter_col, filter_val in include.items(): print('\t- Including only rows with \'' + filter_col + '\' = \'' + ', '.join(filter_val) + '\'') # print(new_df.size) if new_df.empty: df_filtered = df[df[filter_col].isin(filter_val)] new_df = new_df.append(df_filtered) else: new_df = new_df[new_df[filter_col].isin(filter_val)] # print(new_df)#.head()) exclude = {} for filter_value in criteria.split(','): filter_value = filter_value.strip() if filter_value.startswith('~'): # print('\t- Excluding all rows with \'' + col + '\' = \'' + val + '\'') filter_value = filter_value[1:] col, val = filter_value.split(':')[0], filter_value.split(':')[1] if val == '\'\'': val = '' if col not in exclude: exclude[col] = [val] else: exclude[col].append(val) # print('Exclude:', exclude) for filter_col, filter_val in exclude.items(): print('\t- Excluding all rows with \'' + filter_col + '\' = \'' + ', '.join(filter_val) + '\'') if new_df.empty: df = df[~df[filter_col].isin(filter_val)] new_df = new_df.append(df) else: new_df = new_df[~new_df[filter_col].isin(filter_val)] # print(new_df)#.head()) return new_df # filtering criteria if filter_file not in ['', None]: dfC = load_table(filter_file) dfC['action'] = dfC['action'].apply(lambda x: '~' if x == 'exclude' else '') # exclude -XX-XX missing dates dfC['filter'] = dfC['action'].astype(str) + dfC['column'].astype(str) + ':' + dfC['value'].astype(str) filters = ', '.join(dfC['filter'].tolist()) dfM = filter_df(dfM, filters) # open genome sampling matrix dfS = load_table(sampling_file) print('\n### Removing genomes with incomplete dates') # remove genomes with incomplete dates dfM = dfM[dfM[date_col].apply(lambda x: len(x.split('-')) == 3)] # accept only full dates dfM = dfM[dfM[date_col].apply(lambda x: 'X' not in x)] # exclude -XX-XX missing dates # filter by date today = time.strftime('%Y-%m-%d', time.gmtime()) dfM[date_col] = pd.to_datetime(dfM[date_col]) # converting to datetime format if start_date == None: start_date = dfM[date_col].min() if end_date == None: end_date = today # converting dates back to string format dfM[date_col] = dfM[date_col].apply(lambda x: x.strftime('%Y-%m-%d')) print('\n### Filtering genomes by date') # filter genomes based on sampling date def filter_bydate(df, date): df[date] = pd.to_datetime(df[date]) # converting to datetime format mask = (df[date] > start_date) & (df[date] <= end_date) # mask any lines with dates outside the start/end dates df = df.loc[mask] # apply mask return df dfM = filter_bydate(dfM, date_col) # print(dfM) print('\n### Removing genomes tagged for removal') # list of sequences to be ignored in all instances remove_sequences = [] if remove not in ['', None]: for id in open(remove, "r").readlines(): if id[0] not in ["#", "\n"]: id = id.strip() remove_sequences.append(id) # print('\t- Checking if genomes have metadata, and removing if negative') # check if available sequences have metadata meta_seqs = dfM[id_col].to_list() intersection = set(fasta_headers).intersection(meta_seqs) def Diff(li1, li2): return (list(list(set(li1) - set(li2)) + list(set(li2) - set(li1)))) remove_sequences = remove_sequences + Diff(intersection, meta_seqs) # list of sequences to be kept in all instances keep_sequences = [] for id in open(keep, "r").readlines(): if id[0] not in ["#", "\n"]: id = id.strip() if id in meta_seqs: keep_sequences.append(id) else: remove_sequences.append(id) # keep or remove specific sequences dfM = dfM[dfM[id_col].isin(intersection)] # include only sequences with metadata dfM = dfM[~dfM[id_col].isin(remove_sequences)] # remove bad quality sequences ### FIX OR ADD NEW COLUMNS IN THE METADATA # converting dates back to string format dfM[date_col] = dfM[date_col].apply(lambda x: x.strftime('%Y-%m-%d')) # create time unit column # time_cols = [] def get_newunit(value): if value[0].isdecimal(): date = pd.to_datetime(value) if unit == 'week': epiweek = str(Week.fromdate(date, system="cdc")) # get epiweeks year, week = epiweek[:4], epiweek[-2:] if weekasdate in ['start', 'end']: if weekasdate == 'start': epiweek = str(Week(int(year), int(week)).startdate()) else: epiweek = str(Week(int(year), int(week)).enddate()) else: epiweek = year + '_' + 'EW' + week # if epiweek not in time_cols: # time_cols.append(epiweek) return epiweek elif unit == 'month': year_month = date.strftime("%Y-%m") # if year_month not in time_cols: # time_cols.append(year_month) return year_month elif unit == 'year': year = date.strftime("%Y") # if year not in time_cols: # time_cols.append(year) return year elif unit == 'full': return 'total' else: if unit == 'full': return 'total' else: return value dfM['time_unit'] = dfM[date_col].apply(lambda x: get_newunit(x)) # fix place of origin when disagreements between 'place' and 'place_exposure' exist if 'exposure' in geo_level: geo_columns = ['region', 'country', 'division'] for level in geo_columns: exposure_column = level + '_exposure' for idx, row in dfM.iterrows(): if dfM.loc[idx, exposure_column].lower() in ['', 'unknown']: dfM.loc[idx, exposure_column] = dfM.loc[idx, level] # get ISO alpha3 country codes codes = {} def get_iso(country): global codes if country not in codes.keys(): try: isoCode = pyCountry.country_name_to_country_alpha3(country, cn_name_format="default") codes[country] = isoCode except: try: isoCode = pycountry.countries.search_fuzzy(country)[0].alpha_3 codes[country] = isoCode except: codes[country] = '' return codes[country] us_state_abbrev = { 'Alabama': 'AL', 'Alaska': 'AK', 'American Samoa': 'AS', 'Arizona': 'AZ', 'Arkansas': 'AR', 'California': 'CA', 'Colorado': 'CO', 'Connecticut': 'CT', 'Delaware': 'DE', 'District of Columbia': 'DC', 'Washington DC': 'DC', 'Florida': 'FL', 'Georgia': 'GA', 'Guam': 'GU', 'Hawaii': 'HI', 'Idaho': 'ID', 'Illinois': 'IL', 'Indiana': 'IN', 'Iowa': 'IA', 'Kansas': 'KS', 'Kentucky': 'KY', 'Louisiana': 'LA', 'Maine': 'ME', 'Maryland': 'MD', 'Massachusetts': 'MA', 'Michigan': 'MI', 'Minnesota': 'MN', 'Mississippi': 'MS', 'Missouri': 'MO', 'Montana': 'MT', 'Nebraska': 'NE', 'Nevada': 'NV', 'New Hampshire': 'NH', 'New Jersey': 'NJ', 'New Mexico': 'NM', 'New York': 'NY', 'North Carolina': 'NC', 'North Dakota': 'ND', 'Northern Mariana Islands': 'MP', 'Ohio': 'OH', 'Oklahoma': 'OK', 'Oregon': 'OR', 'Pennsylvania': 'PA', 'Puerto Rico': 'PR', 'Rhode Island': 'RI', 'South Carolina': 'SC', 'South Dakota': 'SD', 'Tennessee': 'TN', 'Texas': 'TX', 'Utah': 'UT', 'Vermont': 'VT', 'Virgin Islands': 'VI', 'Virginia': 'VA', 'Washington': 'WA', 'West Virginia': 'WV', 'Wisconsin': 'WI', 'Wyoming': 'WY' } # add state code if 'code' not in dfM.columns.to_list(): dfM.insert(1, 'code', '') if 'division' in geo_level: dfM['code'] = dfM[geo_level].apply(lambda x: us_state_abbrev[x] if x in us_state_abbrev else '') elif 'country' in geo_level: dfM['code'] = dfM[geo_level].apply(lambda x: get_iso(x)) else: dfM['code'] = dfM[geo_level] # set geo_level as code geo_level = 'code' # empty matrix dataframe columns = sorted(dfM['time_unit'].unique().tolist()) rows = sorted(dfM[geo_level].astype(str).unique().tolist()) dfG = pd.DataFrame(index=rows, columns=columns) dfG.index.name = geo_level for column in columns: for row in rows: dfG.at[row, column] = [] # add pre-selected genomes to matrix for genome in keep_sequences: if genome in dfM[id_col].to_list(): # print(genome) metadata = dfM.loc[dfM[id_col] == genome] location = metadata[geo_level].values[0] time_unit = metadata['time_unit'].values[0] # print(location, time_unit) if genome not in dfG.loc[location, time_unit]: dfG.at[location, time_unit] += [genome] # print(dfG) # print(seed) print('\n### Starting sampling process...\n') # sampling process random.seed(seed) # pseudo-random sampling seed glevel = dfM.groupby(geo_level) for name, dfLevel in glevel: if name in dfS[geo_level].to_list(): gUnit = dfLevel.groupby('time_unit') # geolevel-specific dataframe for time_unit, dfUnit in gUnit: available_samples = dfUnit['time_unit'].count() # genomes in bin try: target_sampling = int(dfS.loc[dfS[geo_level] == name, time_unit]) except: target_sampling = 1 # available_samples # take this number of genomes when not epidata is available # print('') # print(name, time_unit, '-', available_samples, target_sampling, bias) existing = dfG.loc[name, time_unit] # pre-selected sequences, if any was listed in keep.txt if target_sampling >= available_samples: # if requested sample number is higher than available genomes, get all sampled = [sample for sample in dfUnit[id_col].to_list() if sample not in existing] # print(sampled, len(sampled)) elif target_sampling == 1: pool = [sample for sample in dfUnit[id_col].to_list() if sample not in existing] sampled = random.sample(pool, 1) else: pool = [sample for sample in dfUnit[id_col].to_list() if sample not in existing] if target_sampling < len(existing): target_sampling = len(existing) sampled = random.sample(pool, target_sampling - len(existing)) dfG.at[name, time_unit] += sampled # add selected samples to dataframe # export output selected_samples = [] report = {} total_genomes = 0 for idx, row in dfG.stack().iteritems(): place = idx[0] time_period = idx[1] available = str(len(row)) try: target = str(dfS.loc[dfS[geo_level] == idx[0], idx[1]].values[0]) except: target = available print('\t- ' + place + ' on ' + time_period + ': ' + 'requested = ' + target + '; ' + 'sampled = ' + available) name = idx[0] if len(row) > 0: total_genomes += len(row) if name not in report: report[name] = 0 for sample in row: selected_samples.append(sample) report[name] += len(row) # export fasta file print('\n### Exporting sequence list and metadata...\n') outfile1 = open(outfile_sequences, 'w') c = 1 found = [] for id in selected_samples: if id not in found: print('\t- ' + str(c) + '. ' + id) outfile1.write(id + '\n') found.append(id) c += 1 # export metadata dfM = dfM[dfM[id_col].isin(selected_samples)] dfM = dfM.sort_values(by=geo_level) dfM.to_csv(outfile_metadata, sep='\t', index=False) # export report outfile3 = open(outfile_report, 'w') outfile3.write('# Seed for pseudo-random sampling: ' + str(seed) + '\n\n') outfile3.write( '# A total of ' + str(total_genomes) + ' sequences selected from ' + str(len(report)) + ' locations\n\n') for loc, count in report.items(): outfile3.write(str(count) + '\t' + loc + '\n') outfile3.write('\n\n# A total of ' + str( len(remove_sequences)) + ' were removed due to lack of metadata, or as listed in remove.txt\n\n') for sample in remove_sequences: outfile3.write(sample + '\n') outfile3.write('\n\n# A total of ' + str(len(keep_sequences)) + ' samples were forcibly added as listed in keep.txt\n\n') for sample in keep_sequences: outfile3.write(sample + '\n') print('\nTotal sampled genomes: ' + str(total_genomes) + '\n') |
37 38 39 40 41 42 43 44 45 | shell: """ python3 scripts/get_genome_matrix.py \ --metadata {input.metadata} \ --index-column {params.index} \ --extra-columns {params.extra_columns} \ --date-column {params.date} \ --output {output.matrix} """ |
63 64 65 66 67 68 69 70 71 72 73 74 75 76 77 | shell: """ python3 scripts/aggregator.py \ --input {input.genome_matrix} \ --unit {arguments.unit} \ --format {params.format} \ --output {output.output1} python3 scripts/aggregator.py \ --input {input.case_matrix} \ --unit {arguments.unit} \ --format {params.format} \ --start-date {params.start_date} \ --output {output.output2} """ |
95 96 97 98 99 100 101 102 103 104 105 | shell: """ python3 scripts/correct_bias.py \ --genome-matrix {input.genome_matrix} \ --case-matrix {input.case_matrix} \ --index-column {params.index} \ --baseline {params.baseline} \ --output1 {output.output1} \ --output2 {output.output2} \ --output3 {output.output3} """ |
134 135 136 137 138 139 140 141 142 143 144 145 146 147 148 149 150 151 152 153 154 155 156 | shell: """ python3 scripts/subsampler_timeseries.py \ --metadata {input.metadata} \ --genome-matrix {input.corrected_matrix} \ --max-missing {params.missing} \ --refgenome-size {params.size} \ --keep {input.keep} \ --remove {input.remove} \ --filter-file {input.filter_file} \ --seed {params.seed} \ --index-column {params.id_column} \ --geo-column {params.geo_column} \ --date-column {params.date} \ --time-unit {params.time_unit} \ --weekasdate {params.weekasdate} \ --start-date {params.start} \ --end-date {params.end} \ --sampled-sequences {output.output1} \ --sampled-metadata {output.output2} \ --report {output.output3} echo '# Sampling proportion: {arguments.baseline}' | cat - {output.output3} > temp && mv temp {output.output3} """ |
163 164 165 166 | shell: """ rm -rfv {params} """ |
Support
- Share:
-

-

-

- Future updates
Related Workflows


